Purpose
If you are encountering issues with the Call Center Queue that was built using Amazon Connect, you can use CloudWatch as a debugging tool. CloudWatch collects monitoring and operational data in the form of logs, metrics, and events, and visualizes it using automated dashboards so you can get a unified view of your AWS resources, applications, and services that run on AWS and on-premises.
Enable CloudWatch
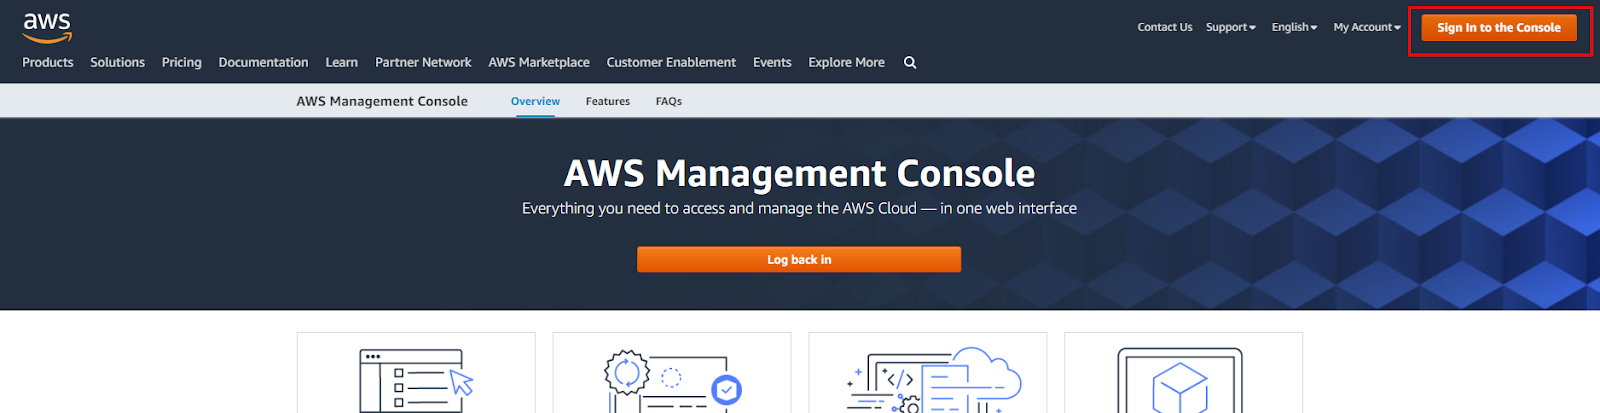
Navigate to https://console.aws.amazon.com/ and log into the console using your credentials.
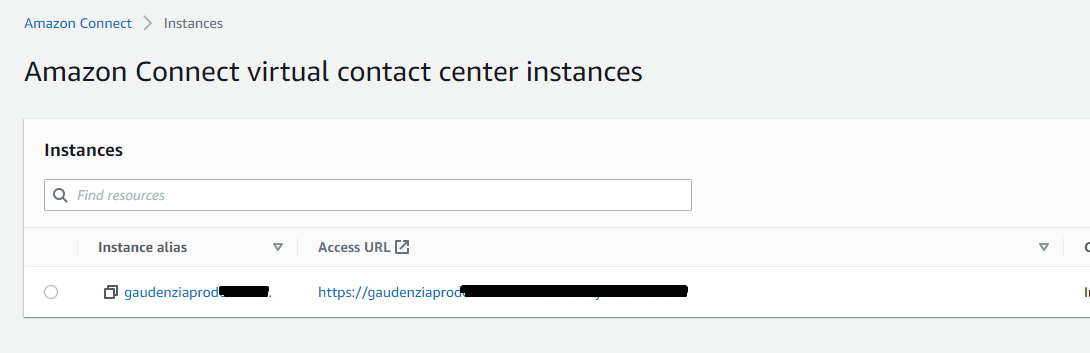
Verify that the server selected is the server that your Amazon Connect instance is located in. You can test this by entering Amazon Connect into the search bar, and verifying that your instance appears.
Click on the hyperlink under the instance alias column
From the Account Overview screen, select Contact Flows from the menu on the left.
Scroll down, and verify that the setting to Enable Contact Flows is selected, and click Save if not.


Obtain Contact ID for the Caller you would like to query.
From Salesforce, go to Setup, and using the Quick Find box locate Amazon Contact Centers
Click on the hyperlink for Telephony Provider Settings. If you encounter an error that states you do not have proper permissions, your profile is likely missing the Contact Center Administrator permission set.
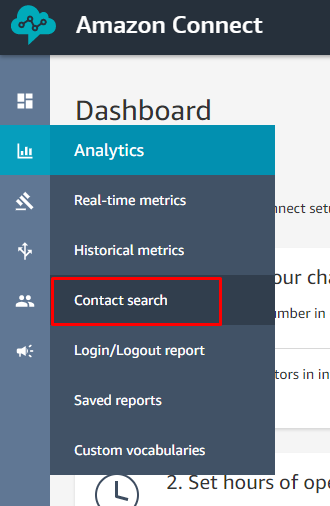
From the Amazon Connect Dashboard, open the analytics tab from the menu on the left, and select Contact Search
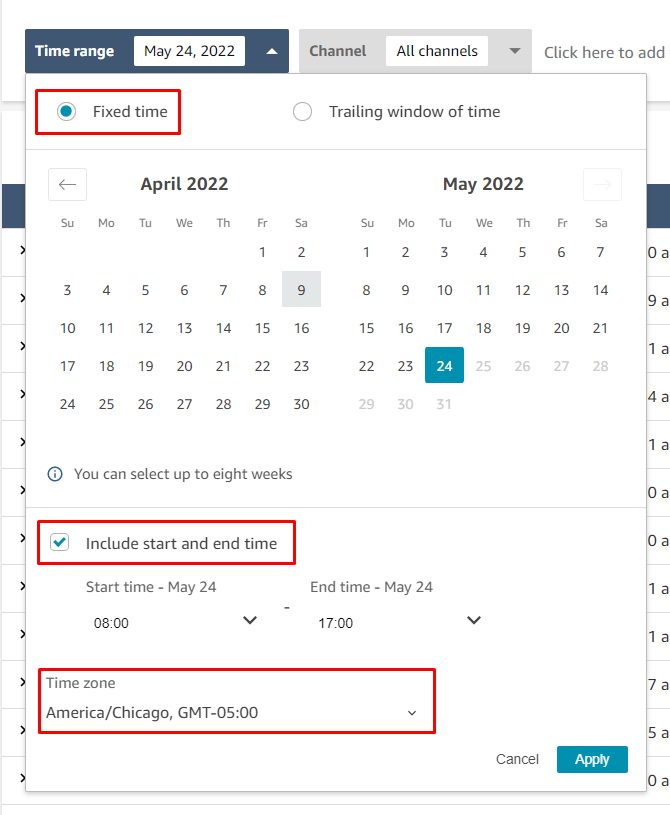
Click on the Time Range button, and enter the range of time during which the call came in that you would like to track.
In the Customer Phone Number Column, locate the phone number of the caller you would like to track. Obtain the Contact ID from the Contact ID column.


CloudWatch Queries
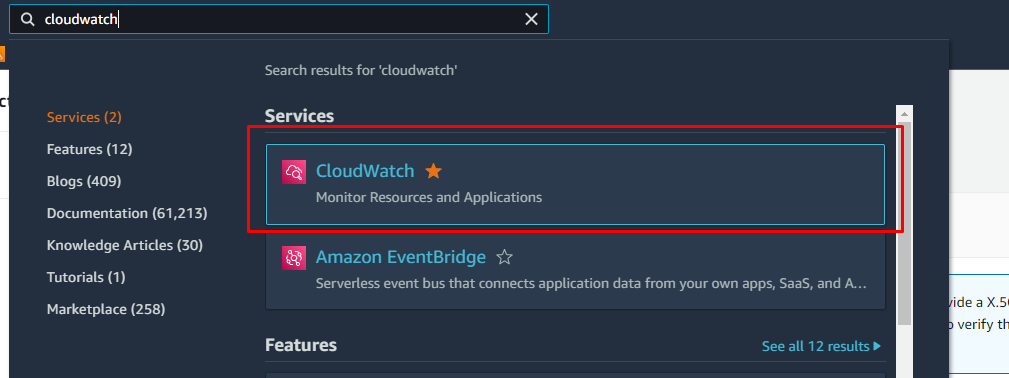
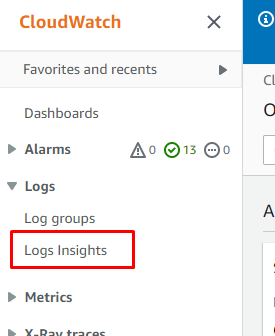
From the AWS Console, Type CloudWatch into the search bar and select it.
From the menu on the left, select the Logs dropdown, and select Logs Insights
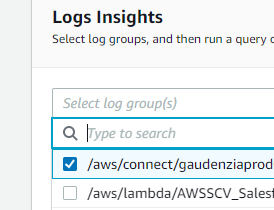
Select the Log Group to query (The first /aws/connect/**** option should be the general queue)
Select the timeframe you would like to view queries for by selecting the timeframe from the option in the top right
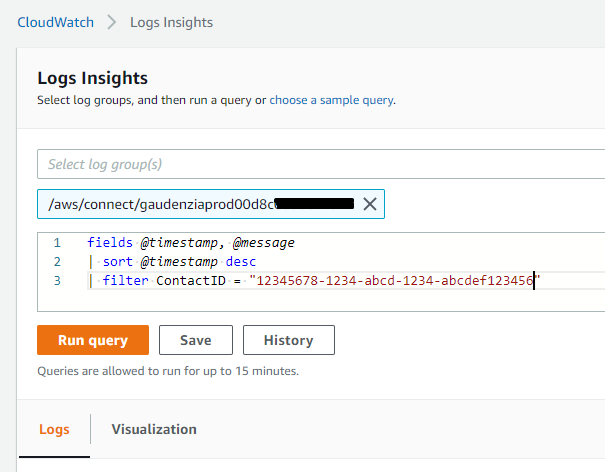
Enter your query into the code editor, and select Run (example query below).

fields @timestamp, @message
sort @timestamp desc
filter ContactId = "enter-your-contactid"

Review Contact Flow to Determine Issues
Now that you have the CloudWatch Logs, In Salesforce you can navigate to the Amazon Contact Center menu in Setup, and select Telephony Provider Settings.
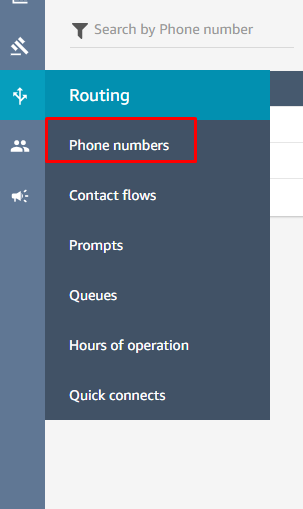
From the Contact Center Dashboard, you can open the Routing option from the menu on the left, and select Phone Numbers
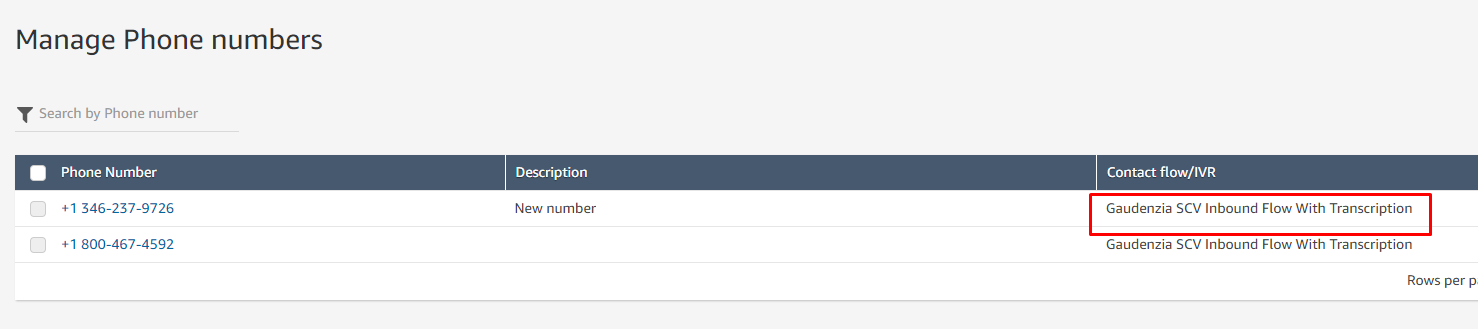
From the Manage Phone Numbers menu, observe which Contact Flow is associated with the phone number that the inbound call called.
From the Routing Menu, select Contact Flows.
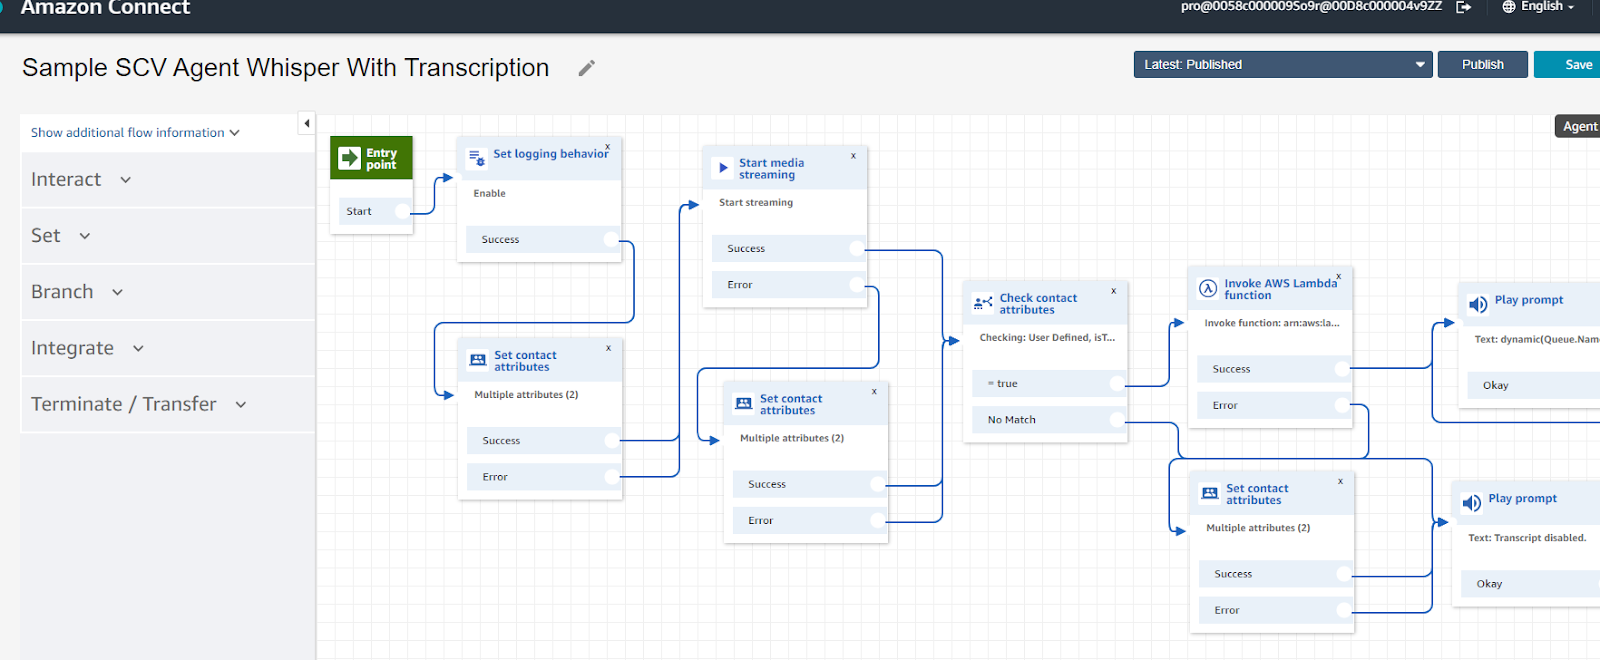
Open the Contact Flow that was associated with the phone number from a previous step.
Using your CloudWatch logs, starting from the last number on the log, follow along on your contact flow to see the choices and attributes that were assigned to the Contact ID when they called in.